"Government needs first and foremost to look to its own failings. Incompetent and bloated government is one of the most serious factors holding the British economy back".
Wednesday, 24 March 2010
Comment by Roger Bootle: Budget 2010
US Debt Much Worse than Thought
Re-counting the US budget deficit forecasts, courtesy of the CBO...
RECENTLY the Congressional Budget Office (CBO) published its scoring of President Obama's budget for the next 10 years, writes Bud Conrad, editor of The Casey Report.
It shows a budget deficit of $9.8 trillion. That is just shy of $4 trillion worse than the CBO's baseline budget, a budget that includes only the laws as currently enacted, with no estimates of any new programs lawmakers may add that worsen future projections.
That our budget is out of control is no surprise, but the charts I present here should provide some perspective of just how dangerous this set of budget estimates could turn out to be. The first chart below shows the amount of red ink in each year for the two CBO estimates.
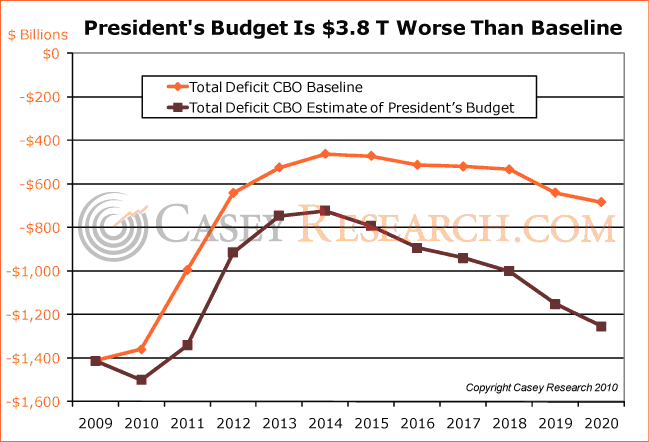
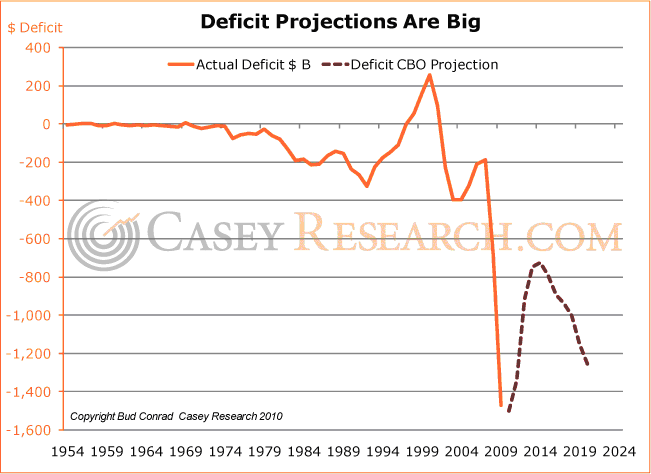
To get a visual interpretation of just how big these budget deficits have become, I plotted the long-term history, then tacked on the CBO evaluation of the president's proposal. Knowing the propensity of governments to spend more than they promise makes one question if the large improvement shown in the dotted line will actually occur.
Even if nothing changes, however, the results look like they could be very damaging for other aspects of our economy.
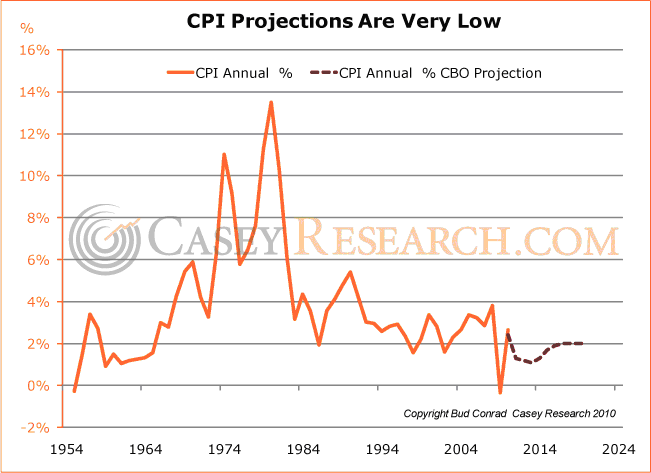
One aspect of the CBO projections that is difficult to defend is the expectation that inflation will stay incredibly low. In the next chart, I present the same sort of long-term history, coupled with the projection, for the Consumer Price Index (CPI).
In the next chart, I put together two of the most important measures: the three-month T-bill interest rate and the deficit expressed as a percentage of the gross domestic product (GDP). Both history and projection are shown.
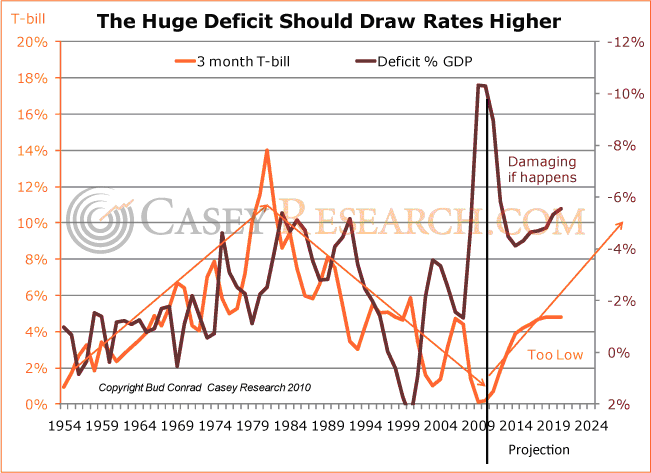
The most important observation is just how disastrous the current deficit is in the historical context, even after rationalizing it by dividing it by the GDP. I overlaid the two series to show that higher deficits in the past tended to occur along with higher interest rates.
As you can see, we now have a significant anomaly, with the budget deficit at its worst in half a century, while interest rates remain near their lows for the period. A closer look at history shows many divergences, to the point that in the short term these two series tend to bounce in opposite directions. That is probably because when the economy shows weakness, the government expands its spending and collects lower taxes, so the deficit becomes worse. Thus, in the short-term cycle of a few years, these two measures often move in opposite directions.
But the situation we face now is much bigger than anything we've seen since the 1950s. The government bailouts and stimulus are at record levels, and the special actions of the Federal Reserve have driven interest rates close to 0%. It is my expectation that both inflation and interest rates will rise dramatically because of these large deficits.
I also think the projected interest rates are much lower than what I expect the deficit would require. As foreigners and others recognize how seriously indebted the US government is becoming, they will expect higher interest rates to compensate for the debasement of the currency.
The budget analysis goes further in calculating the expected growth of the economy, which ranges from 2 to 4% over the years. Those are not large numbers for real GDP, but there is no expectation of another recession during the decade. If the economy didn't grow, tax revenue would be less, and the budget deficit would be worse.
While interest rates are expected to rise as shown in the chart above, the projections expect that they roll over and stop rising at around 5%. That is contrary to my expectations that they will be much higher, and even perhaps closer to 10%, by the end of the decade. If they are, the cost of funding the outstanding government borrowing escalates rapidly because the increased interest has to be added to the debt so that the debt grows even more.
The problem from the onset of this crisis has been the debt, and that continues to be the case. Leaving aside the above two adjustments that could make the budget deficit worse, it's helpful to look at the outcome with the given assumptions and see where it leads. Perhaps the most problematic result is that the debt of the federal government held by the public grows from $7.5 trillion in 2009 to $20 trillion by 2020. Such big numbers are hard to understand, though you can get some sense of things by considering that the government is intending on almost tripling the debt in just 11 years.
The ratio of this outstanding debt to the GDP gives a flavor of how dangerous the situation has become. As Ken Rogoff and Carmen Reinhart have indicated in their new book, when we approach 90% government debt of GDP, we have serious potential for a currency crisis. As you can see, we are well on our way to those levels, even without assuming the two adjustments above.
How will the deficit be funded?
The question arises who will service the rising levels of debt. Clearly the taxpayers are on the hook for all these projections, with more to come. So the question becomes whether the tax base can grow fast enough to provide support for servicing the debt.
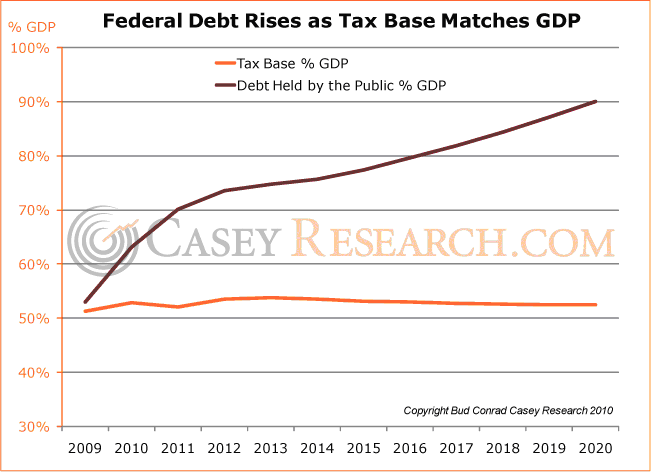
The CBO gave us two series for the tax base. One is Domestic Economic Profits, and the other is Wages and Salaries. The basic assumption is that these are the main revenue streams that can be taxed by the government to fund its expenses. I added these two series together and divided by the GDP to determine if the tax base is growing more rapidly than the economy. Unfortunately, but as expected, the orange line in the above graph shows that the tax base only grows about as fast as the economy itself. That's not surprising, but the contrast to the rapid growth in debt will be a serious source of problems, as the only way the debt can be sustained will be through increasing the tax rates, and probably quite dramatically.
The latest set of budget predictions will probably be wrong, and not just because the assumptions are too optimistic, but because there is a relatively high probability that something will go off track to cause a major shift before the 10 years are completed.
Unfortunately we are not preparing ourselves for such problems, and so I would interpret the CBO projections as being far too rosy.
Ready to Buy Gold today...?
RECENTLY the Congressional Budget Office (CBO) published its scoring of President Obama's budget for the next 10 years, writes Bud Conrad, editor of The Casey Report.
It shows a budget deficit of $9.8 trillion. That is just shy of $4 trillion worse than the CBO's baseline budget, a budget that includes only the laws as currently enacted, with no estimates of any new programs lawmakers may add that worsen future projections.
That our budget is out of control is no surprise, but the charts I present here should provide some perspective of just how dangerous this set of budget estimates could turn out to be. The first chart below shows the amount of red ink in each year for the two CBO estimates.
To get a visual interpretation of just how big these budget deficits have become, I plotted the long-term history, then tacked on the CBO evaluation of the president's proposal. Knowing the propensity of governments to spend more than they promise makes one question if the large improvement shown in the dotted line will actually occur.
Even if nothing changes, however, the results look like they could be very damaging for other aspects of our economy.
One aspect of the CBO projections that is difficult to defend is the expectation that inflation will stay incredibly low. In the next chart, I present the same sort of long-term history, coupled with the projection, for the Consumer Price Index (CPI).
In the next chart, I put together two of the most important measures: the three-month T-bill interest rate and the deficit expressed as a percentage of the gross domestic product (GDP). Both history and projection are shown.
The most important observation is just how disastrous the current deficit is in the historical context, even after rationalizing it by dividing it by the GDP. I overlaid the two series to show that higher deficits in the past tended to occur along with higher interest rates.
As you can see, we now have a significant anomaly, with the budget deficit at its worst in half a century, while interest rates remain near their lows for the period. A closer look at history shows many divergences, to the point that in the short term these two series tend to bounce in opposite directions. That is probably because when the economy shows weakness, the government expands its spending and collects lower taxes, so the deficit becomes worse. Thus, in the short-term cycle of a few years, these two measures often move in opposite directions.
But the situation we face now is much bigger than anything we've seen since the 1950s. The government bailouts and stimulus are at record levels, and the special actions of the Federal Reserve have driven interest rates close to 0%. It is my expectation that both inflation and interest rates will rise dramatically because of these large deficits.
I also think the projected interest rates are much lower than what I expect the deficit would require. As foreigners and others recognize how seriously indebted the US government is becoming, they will expect higher interest rates to compensate for the debasement of the currency.
The budget analysis goes further in calculating the expected growth of the economy, which ranges from 2 to 4% over the years. Those are not large numbers for real GDP, but there is no expectation of another recession during the decade. If the economy didn't grow, tax revenue would be less, and the budget deficit would be worse.
While interest rates are expected to rise as shown in the chart above, the projections expect that they roll over and stop rising at around 5%. That is contrary to my expectations that they will be much higher, and even perhaps closer to 10%, by the end of the decade. If they are, the cost of funding the outstanding government borrowing escalates rapidly because the increased interest has to be added to the debt so that the debt grows even more.
The problem from the onset of this crisis has been the debt, and that continues to be the case. Leaving aside the above two adjustments that could make the budget deficit worse, it's helpful to look at the outcome with the given assumptions and see where it leads. Perhaps the most problematic result is that the debt of the federal government held by the public grows from $7.5 trillion in 2009 to $20 trillion by 2020. Such big numbers are hard to understand, though you can get some sense of things by considering that the government is intending on almost tripling the debt in just 11 years.
The ratio of this outstanding debt to the GDP gives a flavor of how dangerous the situation has become. As Ken Rogoff and Carmen Reinhart have indicated in their new book, when we approach 90% government debt of GDP, we have serious potential for a currency crisis. As you can see, we are well on our way to those levels, even without assuming the two adjustments above.
How will the deficit be funded?
The question arises who will service the rising levels of debt. Clearly the taxpayers are on the hook for all these projections, with more to come. So the question becomes whether the tax base can grow fast enough to provide support for servicing the debt.
The CBO gave us two series for the tax base. One is Domestic Economic Profits, and the other is Wages and Salaries. The basic assumption is that these are the main revenue streams that can be taxed by the government to fund its expenses. I added these two series together and divided by the GDP to determine if the tax base is growing more rapidly than the economy. Unfortunately, but as expected, the orange line in the above graph shows that the tax base only grows about as fast as the economy itself. That's not surprising, but the contrast to the rapid growth in debt will be a serious source of problems, as the only way the debt can be sustained will be through increasing the tax rates, and probably quite dramatically.
The latest set of budget predictions will probably be wrong, and not just because the assumptions are too optimistic, but because there is a relatively high probability that something will go off track to cause a major shift before the 10 years are completed.
Unfortunately we are not preparing ourselves for such problems, and so I would interpret the CBO projections as being far too rosy.
Ready to Buy Gold today...?
Doug Casey, 24 Mar '10


Doug Casey is a world-renowned investor and author, whose bookCrisis Investing was #1 on the New York Times bestseller list for 29 consecutive weeks, a record at the time.
He has been a featured guest on hundreds of radio and TV shows, including David Letterman, Merv Griffin, Charlie Rose, Phil Donahue, Regis Philbin, NBC News, and CNN; and has been the topic of numerous features in periodicals such as Time, Forbes, People and the Washington Post.
His firm, Casey Research, LLC., publishes a variety of newsletters and web sites with a combined weekly audience in excess of 200,000, largely high net worth investors with an interest in resource development and international real estate.

Please Note: All articles published here are to inform your thinking, not lead it. Only you can decide the best place for your money, and any decision you make will put your money at risk. Information or data included here may have already been overtaken by events – and must be verified elsewhere – should you choose to act on it. Please review our Terms & Conditions for accessing Gold News.
UK Sub Prime Government and Its Sub Prime Thinking
The INFLATION Mega-Trend - The world's subprime governments are sending their economies headlong towards bankruptcy by basically continuing to exchange private debt for public debt as a consequence of the dual forces of paying attention to worthless thesis generated by ivory tower academic economists that populate the institutions that rely on revenues from governments to sustain their existence because they would not survive in the market place precisely because they fail to understand economic and financial reality, and as a consequence of politicians being in the back pockets of the bankster elite that wait for the cash handouts when they leave office.
The politicians and governments DO NOT work in the best interests of the people, instead the are systematically screwing the voters / tax payers out of ALL of their life savings and future earning capacity. In Britain we will shortly face a general election where it is either a vote for party tweedle dum or tweedle dee, neither of whom has done or will do anything to bring any of the bankster's to account for their £1 trillion crime against tax payers, instead the Treasury and Bank of England continue to funnel tax payer cash onto the balance sheets of the bankster banks so as they can continue to pay out bonuses on the basis of fictitious profits.
Both Labour and Conservative politicians are in the back pockets of the bankster elite, NEITHER are capitalist OR socialist. Free Market Capitalism would have demanded that the bankrupt banks go bankrupt. Socialism would have demanded that the interests of the workers be put FIRST ahead of the bankrupt institutions instead of giving them hundreds of billions in cash, that money could have ignited an economic boom if every tax payer had been handed £20,000 in cash ! - NEITHER took place, Instead the politicians in the back pockets of bankster's CHOSE to provide unlimited tax payer funds to the bankrupt banks in exchange for future reciprocal cash hand outs that we will witness as the politicians leave office and politicians market themselves at as much as £5,000 a day to the bankster elites.
The consequences of this remains for the balance sheets of the private sector to improve whilst the balance sheets of the public sector to explode. The governments through money printing are set to continue this which is feeding inflationary mega-trend and the stock market BOOM. Eventually the governments risk defaulting into hyper-inflation (many years from now) which is why it is important for people to protect their wealth from the Inflationary Mega-trend. My New FREE 100 page ebook contains 50 pages of how to protect and grow your wealth from strategies including investing in the stocks stealth multi-year bull market and avoiding government bonds and cash as a consequence of negative real interest rates. (Download Now - FREE).
Meanwhile deflationists continue to miss the obvious in that REAL debt is not what is stated in statistics pumped out by the governments such as UK debt being at 60% of GDP. Real debt and liabilities has the UK at 400% of GDP, we are already well along the path towards high inflation, which IS now manifesting itself in the official inflation indices which over the past few months has seen UK CPI break above 3%. The governments will continue to print money to monetize the huge budget deficits because that is publically far easier to do then to allow for the consequences of deflation. I.e. the masses are far more conditioned and susceptible to have their wealth gradually stolen by means of inflation then countenance the pain associated with deflation and nominal economic contraction. This means inflation proof asset classes will continue to rise in price which includes the major stock indices, and 'most' of the individual stocks they comprise.
The strategy is this - To inflate the debt away, to inflate wage purchasing power away, to give the illusion of economic prosperity when people are in actual fact working twice as hard to buy the SAME goods and services. The ONLY defence people have to protect themselves is to diversify out of fiat currencies as illustrated by some 50 pages of the Inflation Mega-Trend Ebook.
For more mega-trend forecasts across the financial market and implications of the unfolding Inflation Mega-Trend download the NEW FREE Inflation Mega-trend Ebook, which includes analysis and precise forecasts for:
- Interest Rates
- Economy
- Inflation
- Gold & Silver
- Emerging Markets
- Stock Markets
- Stock Market Sectors and Stocks, including ETF's
- Natural Gas
- Agricultural Commodities
- House Prices
- Currencies
- Crude Oil
Download the 100 page for FREE, the only requirement is a valid email address.
Economy - The economies are continuing to improve in terms of GDP growth as a consequence of unlimited money printing and stimulus, this will continue throughout 2010 and into 2011, which continues to paint a favourable stocks picture for the current year at least, therefore continues to support the stocks bull market target of 12,500 for this year as a consequence for the need for risk as a consequence of negative real interest rates.
Corporate Earnings - Corporate earnings have FOLLOWED the stock market higher, despite continuous doom orientated commentary of the past 12 months that has repeatedly stated that corporate earnings forecasts implied stocks could NOT rally. The fact is that corporate earnings are surprising to the upside (no surprise to me). There exists a strong case of delusional thought in the processes of many analysts that hold a particular view then go out to seek out reasons to support that view, which is why they miss WHOLE bull markets. Corporate earnings are NOW rising and far from looking for earnings to collapse into a double dip recession, this IS ONLY the beginning.
We heard the mantra based on WRONG corporate earnings expectations that the market cannot support a P/E of over 25, when in fact real forward P/E is much lower because corporate earnings are MUCH higher, not only that but corporate earnings 'should' continue to surprise to the upside for the whole of 2010 therefore reinforcing the fundamentals for a strong bull market.
In terms of stock market trend this implies positive price action into lead up to Q2 earnings season, which therefore implies that the stock market should be heading higher going into May and into the earnings reporting season which suggests a positive trend into at least Mid May and therefore suggestive of a price trading at new bull market highs. So Corporate earnings suggest the stock market will be trading at new bull market highs during May.
Market Psychology - The mainstream financial media and blogosphere continues to pump FEAR into the minds of investors, FEAR of recession, FEAR of sovereign debt default, FEAR of currency collapse, FEAR of credit crisis II, FEAR of the U.S. Following Japan, FEAR, FEAR, FEAR. Any small bit of bad news is MAGNIFIED on an near daily basis. No wonder small investors are running scared, dumping their cash into bonds and cash. However FEAR is a great driver for a stocks stealth bull market, where the FEARLESS have already wracked up profits of 60%+ whilst the FEARFUL majority look on in well FEAR. As I mentioned in the Inflation Meg-trend Ebook, I do not expect this situation to change for MANY YEARS ! So those that are waiting for good news to abandon fear and invest, won't get what they are waiting for many years when the Dow has long since passed its previous all time high, not until we get to the final stages of the bull market when once more investors are wrapped in the cloak of certainty of profits amidst a new paradigm of every rising stock prices.
So market psychology wise, this bull market is still in its infancy which means all corrections are buying opportunities where the greater the deviation from the high the greater the buying opportunity presented. So far this conclusion has borne immense returns for those that deviate from the normal expected behaviour that concludes towards most investors only joining the bull market when it is time to SELL!
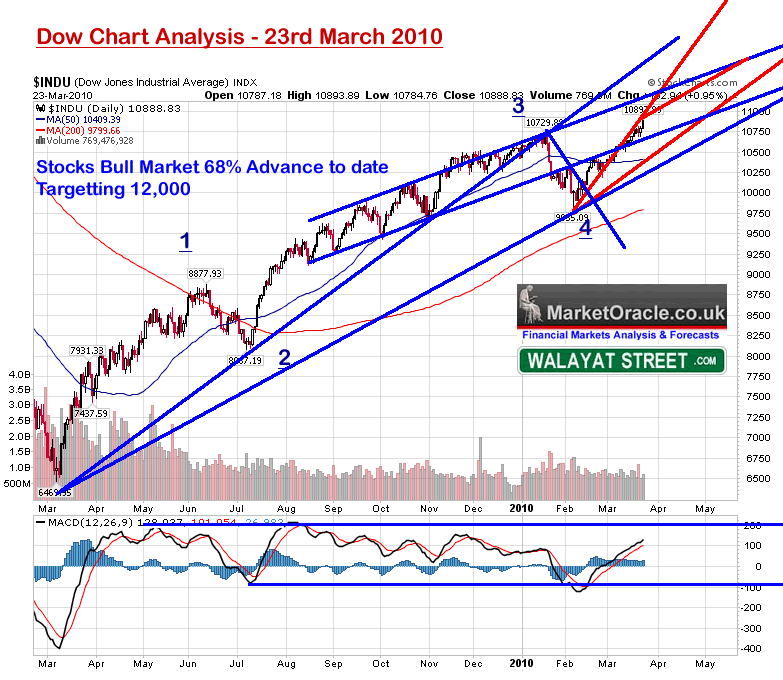
Stock Market Trend Against 2010 Forecast and Expectations
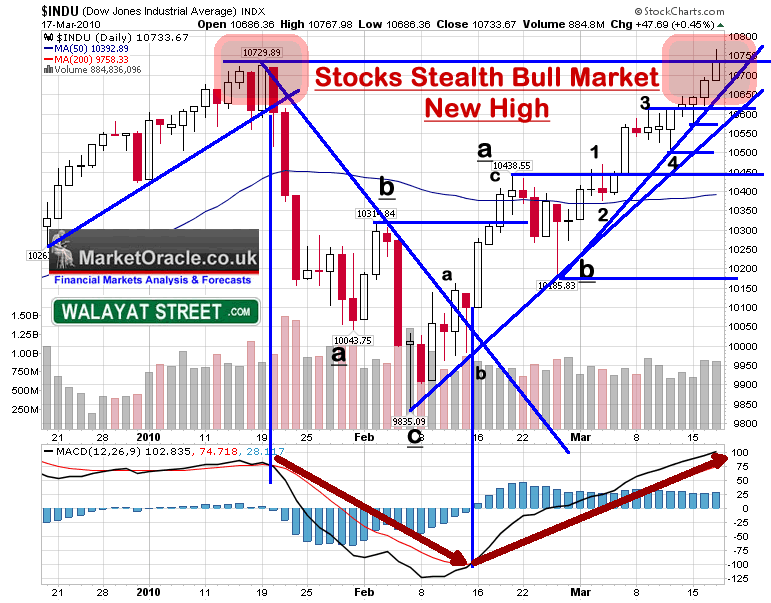
The stocks stealth bull market that bottomed in March 2009 confounded widely held expectations by both the bulls and bears of immediate term price action lower to dissipate its overbought state that failed to materialise, instead the stock market last Wednesday broke to a new bull market high by closing at Dow 10,733 with a further advance on Thursday, followed finally by a small down day on Friday to break a 8 day winning streak with the Dow closing at a new weekly high of 10,742.
The Dow high had lagged other stock indices that had made new highs over previous week including the UK FTSE, S&P500 and Nasdaq (though not other European indices despite the weak Euro).
Stocks Stealth Bull Market Trend Forecast For 2010 - The Inflation Mega-Trend Ebook Page 82 (DIRECT Download)
Dow 10,067 - Stocks Multi-year Bull Market that bottomed in March 2009 will trend Sideways during first half of 2010 attempting to break higher. The second half will see a strong rally to above 12,000 targeting 12,500 during late 2010.
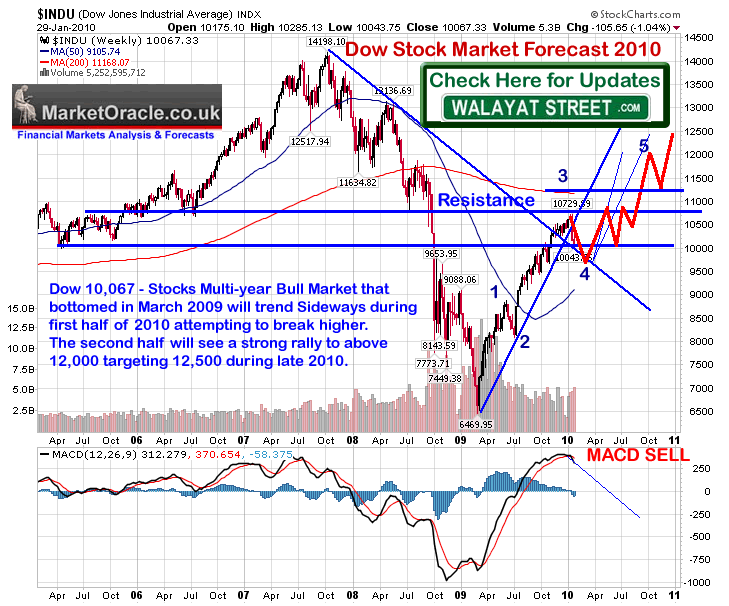
My trend expectation has been for the Dow to trend around its 50% axis (10,333) to conclude in a sideways trend between a support and resistance for between 9,500 and 10,730 for the first half of 2010, the trend off of the early Feb low has shown relative strength against this expectation, especially given the break higher. The stock market forecast for 2010 stated that the market would trend within a volatile trading range for the first half of the year and could generate as many as 3 failed attempts to breakout higher, presently despite its strong action off of the Feb lows, this scenario suggests that the stock market should revert back into its trading range in preparation for the breakout higher later in the year.
Stocks Bull Market Anniversary - To make money you go long (invest) in a bull market and go short (SELL) in a bear market. This bull market is now ONE YEAR OLD! Think about that for a moment, ONE YEAR OLD ! The only thing that has changed during the past 12 months is the reinforcement of trend and capital appreciation.
Many investors who have been fooled into MISSING one of the greatest bull markets in history have been driving the market higher these past few weeks to new highs, which suggests the anniversary is carrying increasing momentum behind it which means despite corrections that will undoubtedly happen, however the weight of new buying pressure is so great that we are likely to see the stock markets go much higher and much sooner than anyone expects (even me!).
TIME ANALYSIS - The Jan to Feb 2010 correction was of a similar duration than the June - July 2009 correction, which implies that both corrections were of a similar order in terms of corrective trends that imply we can therefore expect a powerful multi-month rally to transpire over the coming months taking the Dow far beyond the preceding high of 10,730.
ELLIOTT WAVE THEORY - Since the Market Peaked in January, my interpretation of the EWT component of analysis had resolved towards an wide corrective ABC pattern into the target zone of 9,500 to 9,800. We got the Wave A which terminated at 9,835, which left some doubt at the time whether that was the low or not given that it was just out of the target zone, additionally the downtrend was much shorter in time than necessary to unwind the previous swing higher to 10,729. Nevertheless at the low in early February the EWT pattern did continue to conclude towards B wave rally higher in advance of a further C swing lower.
As indicated in the first chart above, this rally continued higher past the previous swing high of 10,438 WITHOUT correcting. The market has trended higher day in day out for 8 straight days into Friday's small decline. The ABC scenario remained in tact right upto the target of 10,625 after which the scenario was further negated on the break above the bull market peak of 10,730.
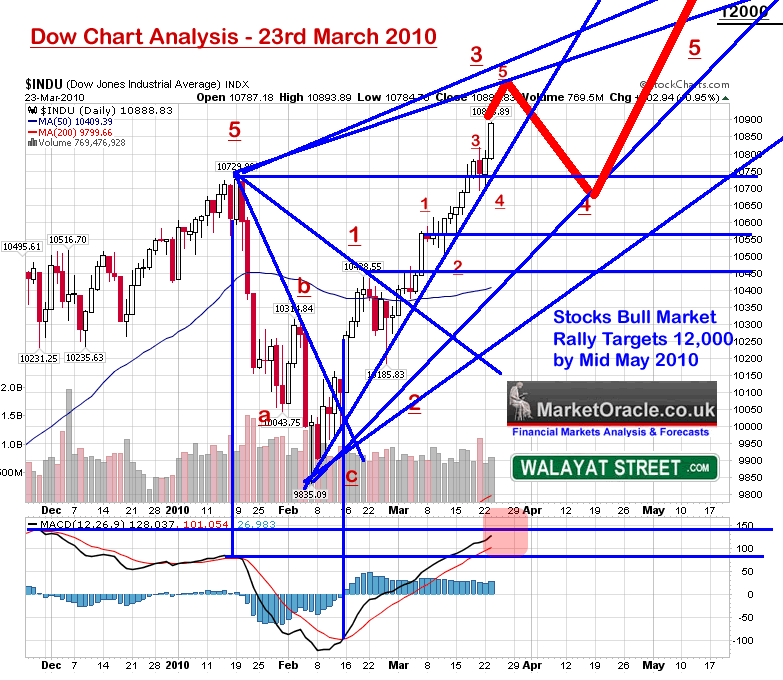
Current interpretation of EWT is illustrated in the graphs below which conclude towards a relatively minor correction during early to mid April (Wave 4), followed by a powerful wave higher into early to mid May 2010 that targets Dow 12,000, as part of a more powerful trend from the early Feb low. Whilst this will clearly be a Wave 5 peak off of the Feb low, however this does not automatically mean that it will be the larger 5th wave juncture for the whole bull market off of the March 2009 lows - No that would be a far too simple interpretation of EWT, always remember EWT is ONE component that needs to be confirmed by the sum of ALL analysis and if need be needs to bend to the sum of that analysis rather than price be forced to fit EWT. So first things first, we need to get the next two months or so of price action out of the way before I contemplate what happens after mid May.
Bear Market and the 1930's Stock Price Chart Pattern - What happened to the bear market that had supposedly resumed following the January high ? A timely reminder from an earlier article (02 Nov 2009 - Stocks Bull Market Forecast Update Into Year End ) as various changing charts from the the 1930's keeps being brought out on every correction to signal the rally's end, I can imagine 4 years and several thousand points higher from now they will still be presented as FACT as to what is going to happen which NEVER DOES!
Stock Market Crash Again?
Forget swine flu, the pandemic doing the rounds is that of another Crash with the 1930's chart dusted down and presented as near fact of what is to transpire on every correction. However the markets response has so far always been to push to a new high for the move.
What happens to the crash calls ? They again get rolled out again on the NEXT correction! However the damage has been done as short stops are hit and losses accrued, that no broker will refund for the next crash call.
There is one major fundamental flaw in the Repeat of the 1930's thesis and that this is 2010 and NOT the 1930's I could also pick a chart form the past that would closely fit onto recent price action to imply the a stock market will soar higher, but that would be more wishful thinking than an actual attempt at trying to generate an accurate projection of future trend which is exactly what has been taking place for the past 12 months! 1930 does not fit, use 1931, then 1932, then 1933, then 1934 and so on, keep changing the charts each time they are proven to be wrong - That is not analysis.
TREND ANALYSIS - The Dow ABC into early Feb was swift and short, bottoming at 9835, just shy of the target of 9,500 to 9,800. The subsequent uptrend has seen little corrective action against it, which is not surprising given that virtually everyone saw it as not sustainable. The trend of the past 3 weeks has been particularly strong which culminated in an 8 day winning streak with the first down day last Friday that marked a brief pause before resuming to a new bull market peak last Wednesday as mentioned above. As of writing there is NO reversal pattern i.e. lower high and last low break to trigger any form of a sell signal which suggests a continuation higher.
SUPPORT / RESISTANCE - Previous resistance of 10730 now becomes support. With the Dow at 10,888 immediate resistance lies at 11,000, that is likely to contain the momentum behind this rally, which suggests that the Dow may mark a corrective trend to target the 10,730 support level therefore implying a bearish outlook for the Dow during early to mid April. Below 10,730 there exists a wide range of support levels all the way down to 10,500 which implies that any price action lower into this range will be choppy and very volatile. On the upside resistance over 11,000 exists at between 11,900 and 12,000, therefore implying a significant correction could take place from that level.
MOVING AVERAGES - The 200 day moving average contained the Jan- Feb 2010 correction and continues to act as a distant support for the bull market. The shorter 50day moving continues to act as short-term support and as a significant correction measuring move for future corrections, current support stands at 10,400, rising to 10,500 by mid April and therefore providing further support to the zone of between 10,730 to 10,500 which could see intra-day spike lower towards the MA at approx 10,500.
PRICE TARGETS - Upside price targets resolve towards 11,000 and 11,900 to 12,000, then 12,500. Downside price targets resolve towards 10,730 to 10,600 with a possible intra-day spike as low as 10,500.
MACD - The MACD confirmed that the last correction was in line with that which transpired during June / July 2009. Whilst the current rally has been strong, however because of the amount of time taken to rise, it has not pushed the MACD into a particularly overbought state. Neither does any negative divergence exist. However on the expectation of a narrowing in momentum for this years stocks bull run, I do expect a more compact MACD pattern which implies stocks could correct BEFORE they reach an overbought extreme, which implies a correction towards the lower end of the MACD range (indicated) could be imminent.
VOLUME - Volume has remained WEAK throughout the rally, which has been one of the main reasons why so much commentary has been bearish during the past 12months. However it is perfectly inline with that of a stealth bull market and also implies that this rally is STILL NOT being bought into. So all of the talk of hyper bullishness investor sentiment since, well summer 2009 basically remains rubbish as there is no sign of such sentiment in the volume, which remains heavier on the declines than the rallies and thus suggestive of SELLING rather than buying into the rally.
SEASONAL TREND - There is a strong seasonal tendency for stocks to rally into Summer then correct in October followed by a sharp rally into December. The seasonal trend is increasingly matching actual chart trend and the unfolding forecast for the next 2 months for a rally into Mid May 2010.
PRESIDENT CYCLE YEAR 2- The impact of the 2nd year of the presidential cycle on the stock market is for a weak trend into September, and a rally in the fourth quarter into the end of the year for a small average gain for the year. This is increasingly becoming contrary to the unfolding trend which implies greater price volatility.
SWING SELL SIGNAL - The nearest swing sell signal is at 10,500. With the Dow at 10,888 the market retains plenty of room to breath, in fact I would not be surprised if the market retraced towards the sell signal before continuing higher.
Stock Market Conclusion
The sum of existing analysis upto the end of January had concluded in the Dow targeting a trend during 2010 to above 12,000, targeting 12,500 by late 2010, to be preceded by a volatile sideways trend during the first half of the year.
As we approach the end of Q1 the trend is showing relative strength against this forecast, the key manifestation of this is that the stock market did NOT retest the February low as I was expecting to take place i.e. to generate a double bottom pattern. This coupled with current analysis (above) suggests we are going to get what cycle analysts would know as 'left translation' in the projected trend, which implies we get the rally to 12,000 far earlier i.e. during Q2, rather than Q3 to Q4. Which on face value also suggests a weaker trend later in the year, but more on that in May.
Dow (DJIA) March to May Stock Market Trend Forecast Conclusion - Therefore my specific conclusion is for a continuation of the uptrend into early to mid May, achieving the 12,000 target during this time period, also allowing for a correction during April as illustrated by the below graph.
Risks to the Forecast
That the market reverts back to the January forecast expectations and delays the trend to above 12,000 until later in the year, at this point I would put a probability of this happening at about 20%.
The next in depth analysis is scheduled to follow during early May 2010 as the current analysis expires. The key question I will answer at that time is whether the stock market under goes a major correction, far greater than that of Jan to Feb or continues trending higher beyond the 12,500 target for 2010. My focus is now primarily on mapping out a trend for UK house prices over the next few years that will conclude in an FREE ebook, to receive this in your email in box, ensure you are subscribed to my always free newsletter.
Hedge Your Portfolio
Stock market and commodity investing is high risk which does require mechanisms to be in place to hedge against being wrong. Just as those that have remained bearish on the stock market this past year have probably long since given up any bear market profits by repeatedly betting against the bull market, the worst thing an investor can do is to give up all of their bull market profits during a bear market. In this regard investors need mechanisms that are able to liquidate / distribute portfolios to cash in the early stages of new bear markets and this mechanism is stop loss orders. The most basic rule is that for a 20% retracement from the last bull run high on an individual stock. The better rule is to identify a preceding significant support level that cannot be breached for ones opinion on the stock to be correct.
A more advanced form of hedging that requires greater experience is to utilise stock index futures and options to partially hedge your portfolio against any decline. The operative word here is that one is hedging, i.e. the returns are to partially offset the loss on the portfolio that is paid for by the portfolio. I.e. dividend income in part finances put options etc.
Labours Last Giveaway Election Budget Tomorrow
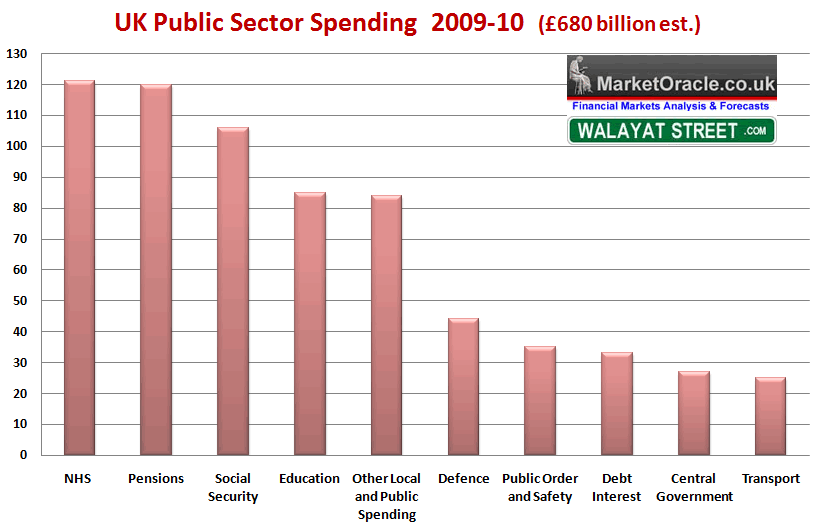
Tomorrow (24th March) is the Labours last budget. The labour government over the past 12 months has bent over backwards in an attempt to ignite an debt fuelled election boom, I just cannot conceive that they will now at this late stage see sense and implement a commonsense budget, so I expect a final throw of the dice, to spend more money that the country does not have and leave the tories with an even bigger debt headache than the 12% annual budget deficit and £1 trillion of public debt that they already face. So expect spending surprises / election bribes tomorrow aimed at Labours traditional voter pool that will likely result in much volatility for sterling.
The axe is hanging over the public sector of which some £65 billion or 10% will be cut which includes the NHS black hole spending department that as we saw with the lengthy report on the REAL performance of one of Britians top ranked hospitals, The Mid Staffordshire NHS Foundation Trust that NHS statistics are fiction against the facts of actual patient experience.
Up to 1,200 patients are thought to have died unnecessarily at the trust between 2005 and 2008.
A damning report on the deaths found chronic staff shortages, receptionists in casualty departments assessing the urgency of cases and nurses switching off equipment that did not know how to use.
Both trusts are “Foundation Trusts” a status supposedly awarded to only the best in the NHS.
I don't mean to be a damp squib to those americans reading this and in an euphoric mood following Obama's healthcare bill being passed by Congress, but the last thing you need is your own version of NHS hell, that routinely kills patients masked by fictitious official data that disintegrates in the face scrutiny under public inquiries and that politicians are too scared to seriously reform due to the army of workers / voters that ride the NHS gravy train. The sooner the NHS is privatised the better the prospects for the health of ordinary Britains.
Your Dow stock index trading and bull market investing analyst.
Source: LINK`http`www.marketoracle.co.uk/Article18125.html`margin-top: 0px; margin-right: 0px; margin-bottom: 0px; margin-left: 0px; padding-top: 0px; padding-right: 0px; padding-bottom: 0px; padding-left: 0px; background-image: initial; background-repeat: initial; background-attachment: initial; -webkit-background-clip: initial; -webkit-background-origin: initial; background-color: transparent; text-decoration: underline; cursor: pointer; color: rgb(144, 0, 0); background-position: initial initial; `LINK
By Nadeem Walayat
LINK`http`www.marketoracle.co.uk/`margin-top: 0px; margin-right: 0px; margin-bottom: 0px; margin-left: 0px; padding-top: 0px; padding-right: 0px; padding-bottom: 0px; padding-left: 0px; background-image: initial; background-repeat: initial; background-attachment: initial; -webkit-background-clip: initial; -webkit-background-origin: initial; background-color: transparent; text-decoration: underline; cursor: pointer; color: rgb(0, 0, 204); background-position: initial initial; `LINK
Copyright © 2005-10 Marketoracle.co.uk (Market Oracle Ltd). All rights reserved.
Nadeem Walayat has over 20 years experience of trading derivatives, portfolio management and analysing the financial markets, including one of few who both anticipated and Beat the 1987 Crash. Nadeem's forward looking analysis specialises on UK inflation,economy, interest rates and the housing market and he is the author of the NEW Inflation Mega-Trend ebook that can be downloaded for Free. Nadeem is the Editor of The Market Oracle, a FREE Daily Financial Markets Analysis & Forecasting online publication. We present in-depth analysis from over 500 experienced analysts on a range of views of the probable direction of the financial markets. Thus enabling our readers to arrive at an informed opinion on future market direction. LINK`http`www.marketoracle.co.uk/`margin-top: 0px; margin-right: 0px; margin-bottom: 0px; margin-left: 0px; padding-top: 0px; padding-right: 0px; padding-bottom: 0px; padding-left: 0px; background-image: initial; background-repeat: initial; background-attachment: initial; -webkit-background-clip: initial; -webkit-background-origin: initial; background-color: transparent; text-decoration: underline; cursor: pointer; color: rgb(0, 0, 204); background-position: initial initial; `LINK
Disclaimer: The above is a matter of opinion provided for general information purposes only and is not intended as investment advice. Information and analysis above are derived from sources and utilising methods believed to be reliable, but we cannot accept responsibility for any trading losses you may incur as a result of this analysis.Individuals should consult with their personal financial advisors before engaging in any trading activities.
Subscribe to:
Posts (Atom)